How I Keep Records
Now I’m going to show you exactly how I keep them, and how those records led me to my first repeatable winning strategy.
We are going to use a spreadsheet to examine your first winning strategy. This was the first approach I discovered that consistently worked, and over the last couple of years I have used the same tool to uncover many more profitable angles. If you are not comfortable with spreadsheets yet don’t worry, this course will teach you everything you need to know.
So now you have to make a decision. This I am afraid, is your last free chapter. Whatever you choose to do, the free winning strategy described later in this chapter is on me. Think of it as a thank you if you like, for bearing with me so far. But as we go on through this course, the real learning begins and it cannot be done without the tool I need to provide you with. i.e., a fully formatted Excel spreadsheet ready to use and loaded with data.
Why Excel Matters When Analysing Horses
This is where Microsoft Excel becomes so powerful. It gives you a way to turn scattered notes, race results, prices, and performance patterns into something clear and usable.
Instead of relying on memory or gut feeling, you can track the key details that matter: the horse, the race, the surface, the draw, the price, the result, and whether the selection matched your rules.
That matters because racing is full of noise. Excel helps you cut through it. It lets you compare form, spot recurring patterns, and test whether a method is actually working rather than simply looking convincing.
In short, Excel is not just a spreadsheet. It is your evidence book. It turns your ideas into something measurable, repeatable, and much easier to improve over time.
The spreadsheet is needed to organise all this information in a way that makes it easy to analyse and draw conclusions. Without it, you would be relying on memory and guesswork, which is far less reliable. It is the only fee we will ask you for to complete the remaining 6 Lessons and you will cover the cost very quickly by applying just a little common sense to it
A Simple Winning Strategy
We will look at over 1000 results that are preloaded into your spreadsheet from January 2026.There is a very good reason for that. On 22 January 2026, something finally clicked. I realised that a system I had been patiently developing over the previous couple of years was no longer just promising — it was making consistent money.
The analysis you will see throughout this section is based on that turning point.
By the end, you will be able to sit down each day, look at the racing cards and meetings, and confidently identify one or two bets that make sense — bets grounded in analysis, not guesswork. Don’t worry if that sounds ambitious. Once you know what to look for, you’ll be surprised how quickly your eye improves.
And the best part? You won’t need to rely on me once you’re winning. You’ll have the tools to do it entirely on your own, and it won’t demand hours of your time.
Before we look at the strategy in detail, make sure you have your spreadsheet open and ready. I have configured it to show a comparison of favourites for over 1000 races in 2016.
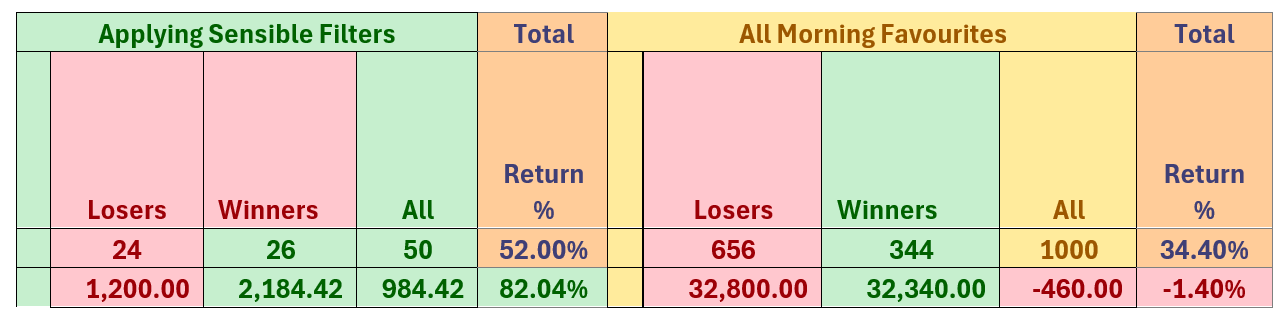
The first thing I want to draw your attention to is how, by betting on every single favourite in every single race using the BPSP you would only have lost a small percentage (1.4%) overall.
This makes sense when you think about it because Betfair charge 2% commission on winning bets. So long term, without any thinking, you should lose just 2% if the market is efficient. And generally, if you make your bet near to the start of the race you won't be far away from that 2% figure.
So, if you are going to lose 2% on average, you need to find a way to beat that figure. That is what we are going to do in this lesson. After all, a loss is still a loss and you’re still a Punter if that remains so.
A Bit of Common Sense
We are going to explore 3 common sense factors that significantly impact the outcome of a race: the surface, the race type and the number of runners.
-
Surface: All Weather vs Turf
Lets select All Weather Racing because potentially it provides a more consistent and predictable environment compared to other types of racing, making it ideal for developing and testing strategies.
-
Race Type: Handicap vs Conditions
Let's check the impact of race type on outcomes. Handicaps tend to be more competitive because the weights are designed to bring the field closer together, which usually reduces the gap between the best and the rest. Conditions races can be more predictable because the runners are often more clearly separated by class, form or fitness.
-
Number of Runners: Field Size
The number of runners in a race can significantly impact the outcome. Larger fields tend to be more unpredictable because there are more variables, more pace changes and more chances for the market to be distorted. Smaller fields are easier to analyse, but they can also become too tight and too dependent on one or two horses.
Applying Sensible Filters
Once you start filtering the data in a sensible way, the true edge becomes much easier to spot.
This is the Bit Most Punters Never Reach
Without the downloaded spreadsheet, you won’t be able to follow along with the examples and exercises in the next section. So it’s here that we will sadly have to leave you.
In the section ahead, I’ll show you exactly what I changed, what I stopped doing, what I started tracking, and how I narrowed the game down until the right bets almost found themselves. We focus first on All Weather racing because, in winter, it is the main alternative to National Hunt racing and offers a more consistent environment to analyse.
In lesson 4 you will see exactly how we moved from a 2% loss to consistent profits. The table below shows the exact result of applying your first winning strategy.
Your first real edge starts here
This is the moment where ordinary punters stop guessing and start following a method. The spreadsheet turns your ideas into evidence, gives you a repeatable process, and shows you exactly how to test your own edge.
With the right filters, the right records, and the right mindset, you can move from hope to structure. That is what this course is really about: giving you the tools to spot value before the market does.
Download the spreadsheet now and start testing the strategy for yourself.
If you want the full framework, the preloaded data, and the same structure that made this approach work, download the spreadsheet today and take the next step with confidence.
A Picture Paints 1000 Words!
So now we can build on everything you have learned so far and show you how to think about favourites in a more disciplined way. The aim is simple: stop following the crowd blindly and start identifying when a favourite is genuinely worth backing.
To get full value from this lesson, make sure you have your spreadsheet open and ready. If you havent got it yet, you will be leaving us soon.
By the end of this lesson, you should have a clearer view of how price, form, and conditions work together, and why value matters more than reputation.
You may already have seen the image below. Look at your spreadsheet and select the tab at the bottom that is entitled "Filtered versus all".
As promised, I am going to keep my word to those who havent yet downloaded the spreadsheet, but before I tell you the strategy, here are the results.
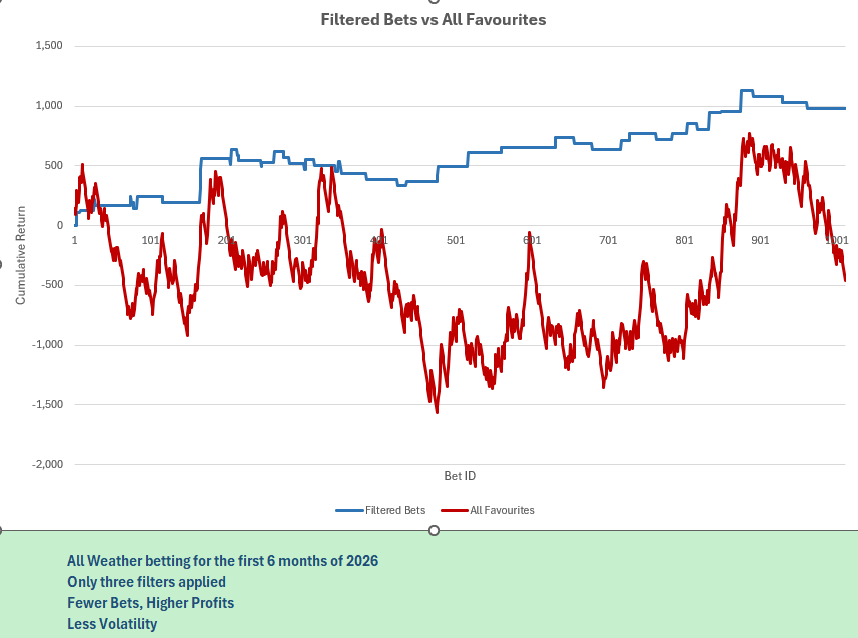
The blue graph above shows the performance of the first winning strategy over the first 6 months of 2026 compared to blindly betting on all the favourites. Believe me, you have come a long way. You have ignored the noise and focused on what truly matters.
Let's just review what we have achieved so far. We have analysed 1012 races where we selected 12 non runners, of the remaining 1000 races, we are now going to use three common sense criteria to select a favourite to bet on. The criteria are
- 1: 8 to 9 runners only.
- 2: Betting only on Non Handicap but also excluding Maiden races
- 3: All-weather races only
Then...
- by making £50.00 bets every time
- and betting on the favourite only when the spreadsheet told us to
- using the BFSP to or as near as we can to make the bet
- we turned a 1.6% loss of £460 over 6 months into a healthy profit of £984.42.
- Reduced the risk of losses by focusing on common sense criteria
- and smoothened the volatility of returns by making far fewer bets
And the best part is that we have done this without any insider knowledge, without any special software, and without any luck. We have done it by applying a disciplined approach to betting on favourites. There is more good news for you however. All you need to do from now on is use the spreadsheet to enter details of All Weather races because the spreadsheet will do all the calculations for you.
Easy when you know how, but there is so much more to learn in the upcoming lessons. Our aim is a simple one: to turn you from a punter into a pro by showing you ways to tilt that blue line in the graph upwards!
If you have not downloaded the spreadsheet, this really is the end of the free lessons. Thank you for reading, and I hope you will decide to continue with us. Maybe you'll come back after realising just how simple it is to move ....